
ThermoREC is an application for making TR4 settings and monitoring temperature data via graphs.
By collecting and plotting data in graph form from logger(s), it provides a way to constantly monitor important temperature changes. The data displayed in Graph View is automatically uploaded to T&D WebStorage Service.
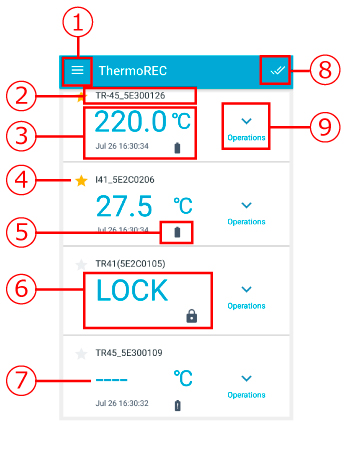
Android 4.4 or later, iOS 9.0 or later
 |
|
|---|---|
 |
Device Name: up to 16 characters |
 |
Current Readings / Data Acquisition Date and Time Tap the measurement to open the graph for the device. See: Graph View |
 |
Favorite (star icon) Data loggers selected as favorites are pinned to the top of the list; the order of favorites can be changed as desired. See: Sorting Favorites |
 |
 indicates the battery level is sufficient. indicates the battery level is sufficient. indicates the battery level is low. (Bluetooth communication may not work properly.) indicates the battery level is low. (Bluetooth communication may not work properly.)You will lose all data if the battery drains completely; make sure to replace the battery as soon as possible. |
 |
These indicate that Device Lock is ON. See: Device Settings > Device Lock |
 |
Dashed Line This will appear when a sensor has not been connected or the wire has been broken. |
 |
Multiple Unit Selection (Android version only) Allows you to select up to 4 units to display in the same graph. See: Graph View > Multiple Unit Selection (Android version only) |
 |
[Operations] Menu
|
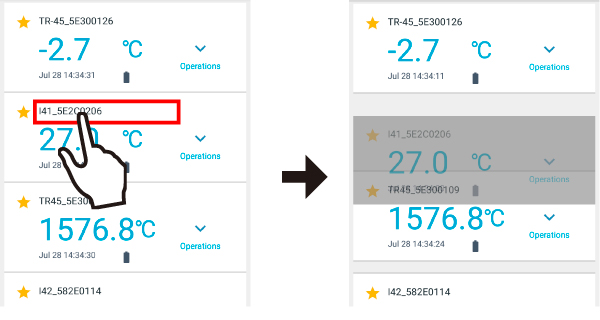
Press and hold the device name until the cell turns gray. Then drag the cell to the desired location.
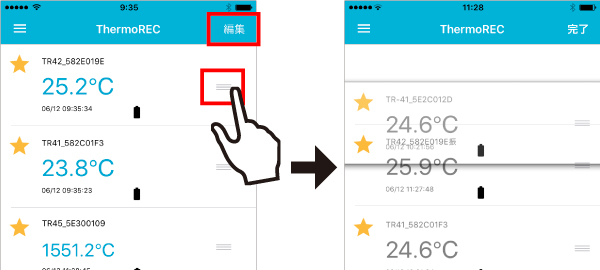
Tap "Edit", press and hold the icon on the right side of the measurement, and then drag to the desired location. When sorting is finished, tap "Done".
By opening Graph View, data monitoring and the downloading of recorded data will start.
Both "recorded data" and "monitoring data" will be uploaded to T&D WebStorage Service upon return to the previous (Top) screen.
See: How to Use the T&D WebStorage Service > Recorded Data and Monitoring Data
|
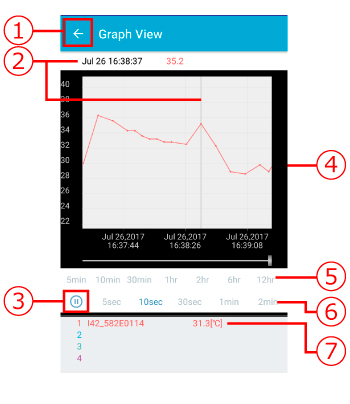
Returns to the previous page. |
|---|---|
|
Date, Time and Measurement / Cursor Press and hold on the graph to display a cursor. The time and measurement of the cursor's position will appear above the graph. |
|
 Pauses or resumes monitoring (graph drawing) Pauses or resumes monitoring (graph drawing) |
|
Graph Area You can pinch in/out to change the graph range. |
|
Data Display Range (16 choices; scroll horizontally) 5min, 10min, 30min, 1hr, 2hr, 6hr, 12hr, 1day, 3day, 1wk, 2wk, 1mon, 2mon, 3mon, 6mon, 1yr. |
|
Monitoring Interval (5 choices) 5sec, 10sec, 30sec, 1min, 2min |
|
Shows the device name and the current reading of the monitored device(s). (Up to 4 units for Android) |
Click ![]() .
.
Select up to 4 units to display in the same graph.
Tap "VIEW IN GRAPH".

In the Top screen click ![]() for the desired device.
for the desired device.
In the menu which appears, select [See Graph Archives].
Specify the period for the archived graph data and select "View in Graph", "Send as File" or "Delete".
In Device Settings you can check the device info, change the recording settings, and start/stop recording.
To open Device Settings, select a target device in the Top screen, tap ![]() and then "Make Settings".
and then "Make Settings".
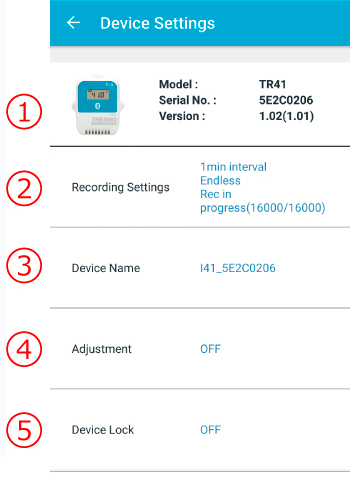
To change the settings, tap on the necessary item from ② to ⑤.
|
Device Information | Model Number, Serial Number, Firmware Version |
|---|---|---|
|
Recording Settings |
|
|
Device Name | |
|
Adjustment | After adjustment settings have been made to a logger, it will display and record only the post-adjusted readings.
|
|
Device Lock | Select ON or OFF. Device Lock protects data from being read or changed by unauthorized persons. When Device Lock is set to ON, the lock icon is displayed in the Top screen. See: Device Settings > Device Lock |
| Rec. Interval | 1 sec | 30 sec | 1 min | 10 min | 60 min |
|---|---|---|---|---|---|
| Time Period | About 4 hours | About 5 days | About 11 days | About 111 days | About 1 year and 10 months |
Overwrite the oldest data when logging capacity is full.
Recording automatically stops when logging capacity is full.
When you are carrying out adjustment settings and formulating equations please take care with the settings and take personal responsibility for the process.
This adjustment method changes only the intercept (b) where the slope (a) is considered to be the value of "one".
For example, the data logger is measuring 10.2°C, but the standard says the actual measurement should be 100°C. Enter 10.2 in the "Before" box and 10 in the "After" box. The conversion equation will be Y=X-0.2 and for all measurements an adjustment to the offset of -0.2 will be made.
The adjustment equation will be calculated from two points: the slope (a) and the intercept (b).
For example, the data logger is measuring 0.2°C and 9.6°C , but the standard says the actual measurements should be 0°C and 100°C. Enter 0.2 and 9.6 in the "Before" boxes and 0 and 10 in the "After" boxes. In this case the slope (a) is (10 - 0) / (9.6 - 0.2) = 1.06.
The conversion equation is Y=1.06X-0.213 with the intercept being -0.213.
When Device Lock is set to ON, instead of a measurement, the word "LOCK" and the lock icon are displayed in the Top screen.
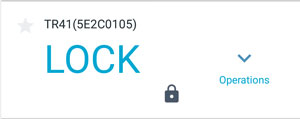
Tapping "LOCK" will open the Registration Code entry screen.
Enter the 8-digit number that is printed on the supplied Registration Code Label.

Your smartphone or tablet will resume communication with the logger and start plotting in the Graph View screen. Measurements will be displayed upon return to the Top screen.
Note: The lock icon will remain on until the Device Lock setting is turned off.
After turning off the LOCK display, tap ![]() in the Top screen.
in the Top screen.
In the menu which appears, select "Device Settings".
Tap "Device Lock" and change to OFF.
The lock icon will disappear upon return to the Top screen. Now the device is unlocked, and operations from any smartphone, tablet, or device with Bluetooth low energy are possible.