Using T&D WebStorage Service
T&D WebStorage Service is a free cloud-based storage service provided by T&D Corporation. It makes it possible to monitor the recorded data and warning status on a web browser, check and change the device settings, manage and download recorded data files collectively.
- Preparation: User and Device Registration
- Monitoring and Graph Display
- Device Settings
- Alert View
- Warning Settings / Warning Email Recipient Settings
- Download
Preparation: User and Device Registration
When using T&D WebStorage Service for the first time, register as a new user and add devices to your account.
User Registration
- Open your web browser and access T&D WebStorage Service from a web browser of a computer or mobile device.
https://webstorage-service.com/ - Click [Get a User ID] to go to the registration page, and enter the email address and password.
- Please read the Service License Agreement and Privacy Policy then check [I agree...]. Click [Submit] to confirm the submission.
- A confirmation email will be sent to the address you entered. Click the link in the email to verify your address and complete the registration process.
IMPORTANT
The user ID cannot be reissued so please keep it in a safe place. If you lose your user ID, you will not be able to use the data stored in the T&D WebStorage Service.
NOTE
- If you are using the Japanese Ondotori Web Storage, access https://ondotori.webstorage.jp/.
Device Registration
- Enter the User ID provided in the registration completion notification email to log in to the T&D WebStorage Service.
- Go to the [Devices] menu and click the [+ Device] button. It will take you to the Add a Device page.
- Enter the serial number and registration code (that can be found on the label supplied with the product), then click [Add].
 If you have multiple devices, repeat the process one device at a time.
Note
- The message [Waiting for first data] is displayed until the recorded data is received. Measurements will appear in the [Data View] window when data is auto-uploaded from the device.
(See: Q&A about T&D WebStorage Service - Q5: I can't view the auto-uploaded recorded data, what should I do? - If you have lost the supplied label, you can use the software to check the device information. (For details, see Q&A about TR7 Series Devices - Q3: Where can I find the Registration Code and Serial Number?)
Monitoring and Graph Display
[Data View] allows you to monitor the measurements and battery status, as well as to view your data in a graph.
| Group Name | This is the group name set in TR7 for Windows (or T&D Thermo). |
| Device Name | This is the device name set in TR7 for Windows (or T&D Thermo). |
| Battery Icon | This shows the remaining battery level. You can receive a warning notification when the battery icon turns red (low battery). |
| Measurement / Updated | Error messages also appear here. |
| Details | Click to open the graph window. Up to the latest 16,000 data readings can be displayed in a graph. It is possible to compare the data of multiple devices in one graph by checking two or more boxes on the left and then clicking [View Graph]. |
| [Clock Display Settings] Button | Click to open the settings window where you can set the date format and daylight savings time display. It is also necessary to adjust the daylight savings time setting by going to [Settings] menu - [Clock Settings] in TR7 for Windows. |
Note
The Watch List in the [Dashboard] allows you to check data instantly every time you open the T&D WebStorage Service. You can add the desired devices to the list and view the most recent measurements as well as click the device name to open the graph window.
Graph Operations
- Hover your cursor over the graph to see the measurement value(s) and date and time of the data sample.
- Click and drag on the graph to zoom in on a specified time range. You can move the displayed period with the horizontal scroll bar.
- Select a button beside "Zoom" to zoom in on a specific fixed period. You can move the displayed period with the horizontal scroll bar.
- Open the menu on the upper right corner for printing graphs and downloading recorded data in various file formats.
Device Settings
Go to the [Devices] menu to check and change the device settings via the network.
| [+ Device] Button | Click to open the device registration screen. (See: Device Registration) Once recording starts and data is uploaded, you can view the data in [Data View]. |
|---|---|
| [Settings] Button | Click to view or change the device settings. (See below) When you change the settings, they will be applied when the device communicates with the T&D WebStorage Service. Until then, a clock icon (  ) appears next to the device name as shown in the above image, indicating that there are pending changes (and a scheduled recording start). ) appears next to the device name as shown in the above image, indicating that there are pending changes (and a scheduled recording start). |
| Remove (Trash icon) | Click to remove the target device and its data (recorded data, warning data, and settings info) from your T&D WebStorage Service account. |
Settings Screen
| [Remove Device] Button | Click to remove the target device and its data (recorded data, warning data, and settings info) from your T&D WebStorage Service account. |
| [Reset Data] Button | Click to reset the graph data and warning data for the target device.
|
| Device Info Channel Settings Warning Settings |
Please see Help for details. Device Name / Group Name / Ch Name / Rec Interval / Rec Mode: Refer to [Starting Recording] Auto-upload Interval: Refer to [Making Auto-Upload Settings] Time Difference / Daylight Savings Time: [Making Clock Settings] Adjustment: Refer to [Adjustment] Warning Settings: [Making Warning Settings] |
| Start recording when the settings are applied | Check here if you want the logger to start recording upon reception of the settings.
|
| [Send Settings] Button | New settings will be applied when the device communicates with the T&D WebStorage Service.
|
Watchdog Settings
The Watchdog function is for detecting devices with which communication has not been occurring.
It monitors the communication status of target devices, and when any of them are out of communication for the set time period, a watchdog alert will be issued and an email notification will be sent. To make settings, select the device and set the timeout period to be monitored, and click [Apply].
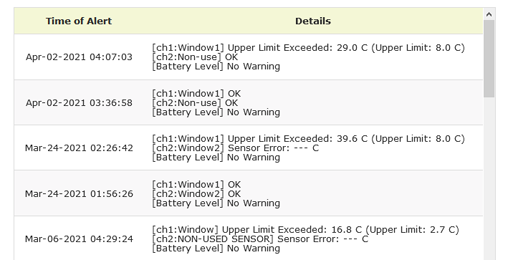
Alert View
When T&D WebStorage Service receives alert information, a red badge will appear on the [Alert View] menu.
For TR7 Series, a warning email will be sent to the email address used at user registration and additional addresses registered under the [Account] menu.
Note:
Alert information includes not only the occurrence of a warning event but also changes of the status (warning recovered or lifted).
- "Warning recovered" means that the device returned to the normal condition.
- "Warning lifted" means that the warning was lifted due to the changes in the warning settings, restart of the recording operation, or reset of the device due to dead battery, etc. (Available for TR71A/72A(-S) firmware Ver.1.19 or later, and TR75A firmware Ver.1.04 or later.)
- The [My Alerts] screen shows a list of devices with current alerts and recovered alerts.
- The [Alert Info] and [Recovery Info] fields show the date and time when information was sent by the device. You can click the field to view log entry details.
- Click the [View Graph] icon to open a graph.
- By clicking the [OK] button, it will be moved to the [Alert Log].
Alert Log / Watchdog Log
In the [Alert Log] screen, you can check the log of past alerts sorted by product series. Click View Log to view log entry details.
The [Watchdog Log] screen shows the devices with watchdog enabled and the alert log.
View Log
You can check the date/time and details of each log entry.
Warning Settings / Warning Email Recipient Settings
You can check or change the warning settings by going to the [Devices] menu and clicking the [Settings] button to open the device info. (See: Device Settings)
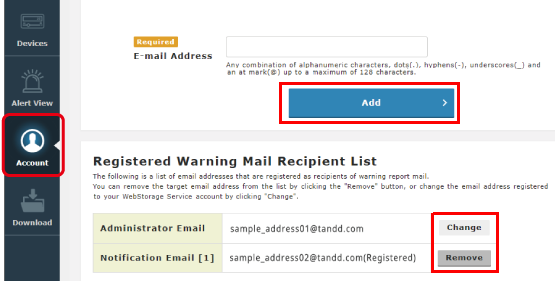
The warning email recipient addresses can be added up to three (except for the email address registered to your user account).
- To add the recipient address, go to the [Account] menu - [Set Warning Recipients] to open the setting window.
- Enter the E-mail Address and click the [Add] button.
- You can change or remove the address in the [Registered Warning Mail Recipient List].
Refer to [Specifications for Warning Transmission] - [Examples of Warning E-mails] for details about the Warning Status Report sent by T&D WebStorage Service and sample messages.
Download
Data files sent manually from the T&D Thermo App's [File List] can be accessed here for graph view and download.
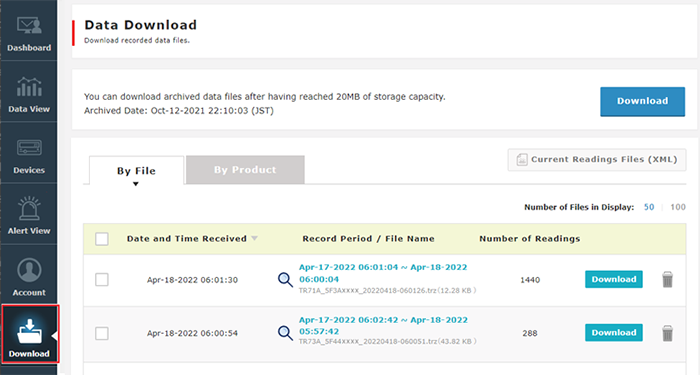
| By File | Data list by file |
| By Product | Data list by product |
| Record Period / File Name | Select the desired file and click in the [Record Period / File Name] column to display the graph. |
| [Download] Button | Click to download the target file. The files are in the TRZ format. You can download multiple files by checking the boxes to the left of the list. |
| Remove (Trash icon) | Click to remove the target file. You can delete multiple files by checking the boxes to the left of the list. |
Note
You may see a message about downloading archived data files. For information about storage capacity and archiving, see the T&D WebStorage Service Details. https://webstorage-service.com/info/
Data Analysis
Further data analysis is possible by using the T&D Graph software in conjunction with T&D WebStorage Service.